SPSS for MBA Project Report Writing: Step-by-Step Help
In the world where everything in data driven it is of utmost important to correctly analyze the data using spss to get the perfect result. Nowadays everywhere form Big organizations to Healthcare to Government and academic Sphere, analyzing data has become the core of running any organization. SPSS (Statistical Package for the Social Service) is a software package which is used for statistical analysis for wide range of data analysis.
In Academics, Scholars and researchers uses SPSS software to interpret their collected data for publishing their paper. Government organization uses SPSS for understanding the demographics, evaluating their policies. In Healthcare, SPSS is used to analyze the public health survey, and deciding policies based on the reports.
What Is SPSS?
SPSS (Statistical Package for the Social Service) is a software package by IBM which helps in calculating a large number of datasets. SPSS is known for in user friendly interface which helps the user analyze difficult analysis without writing any code. It Helps in different analysis like:
- Descriptive Analysis (Mean, Median, Standard Deviation)
- Correlation& Regression Analysis.
- ANOVA, T-Test & Chi Square Tests.
- Different Factor or Cluster Analysis.
- Predictive modelling and Forecasting.
User Friendly Interface
Whenever anyone open a file in IBM SPSS, user will find it looks similar to an Excel Sheet. There will be two tabs -Data View and Variable View. Now before entering the data, user will have to define the variables in the variable View tab. Defining variables in SPSS means telling the software what type of data each column will represent. Example: Age, gender, text, number or Income Group. After the definition is done the user can enter the data manually or can import from different format of file. For different analysis SPSS has drop down tabs helping in calculating the analysis.
How to do Descriptive Analysis in SPSS
Descriptive Analysis is a calculation which uses the raw current and historical data for identifying the trend, pattern and relationship. The main calculation includes Mean, Median, Variance and Standard Deviation.
Understanding the Formula used in the Descriptive Analysis:
 
															 
															How to calculate Corelation Analysis in SPSS.
Corelation Analysis is a method in statistics where it is used to measure the strength and direction of the relationship between two or more variance. It determines the degree to which two or more variables are related. Let’s take Variables like sales, Advertising and manpower costs. Therefore, the corelation question will be – “Does increase in advertisement cost will increase the Sales while reducing the manpower cost?”. Also, in medical analysis Correlation Analysis can be used to study the relationship between variables. Correlation Analysis is often used to asses drug doses and treatment response.
There are 3 main or common type of corelation tests:
- Pearson Corelation: Where both variables are continuous and normally distributed.
- Spearman Rank Corelation: Where data is ordinal and are not normally distributed.
- Kendall’s Tau: Where samples are small and data are ranked.
 
															How to do regression analysis in spss
Regression Analysis is a analysis process where the relationship between one dependent variable is evaluated with one or more independent variables. Regression Analysis are mainly used for prediction and forecasting. To define as an example, a doctor can quantify how much each factor will contribute to the overall risk of patients.
Regression Analysis is a analysis process where the relationship between one dependent variable is evaluated with one or more independent variables.
Types of Regression Analysis
- Simple Linear Regression: Used for evaluating the relationship of one dependent variable with one independent variable.
Formula: Y=a+bX+
Where:
Y=Dependent Variable (Outcome)
X=Independent variable (Predictor)
a= Intercept (Value of Y when X=0)
b=Slope (how much Y changes for a one unit increase in X)
= Error Term.
- Multiple Linear Regression: It is used for evaluating two or more independent variable to predict a dependent variable.
Formula:Y=a+b_1 X_1+b_2 X_2+⋯+b_n X_n+ϵ
Performing Regression Analysis in SPSS
In SPSS performing regression analysis is extremely easy as it used a menu driven interface which allows user to perform the analysis in a few clicks. Once the dataset is imported in the system the user has to select the dependent and independent variables. The software will immediately calculate regression coefficient, R-squared values and the model fit statistics.
 
															How to do chi square test in SPSS
A Chi -Square Test is a process of evaluating the relationships between categorical variables. It is done by comparing the observed frequencies to the expected frequencies. It is normally used in testing hypothesis. This type of test is used mainly to find the product fitness over customer demographics. Investigating the variables between the education level to political opinion. To interpret the Chi-Square result, the focus on p-value and the Chi-square determines the difference between the expected and actual count.
Formula of Chi-Square

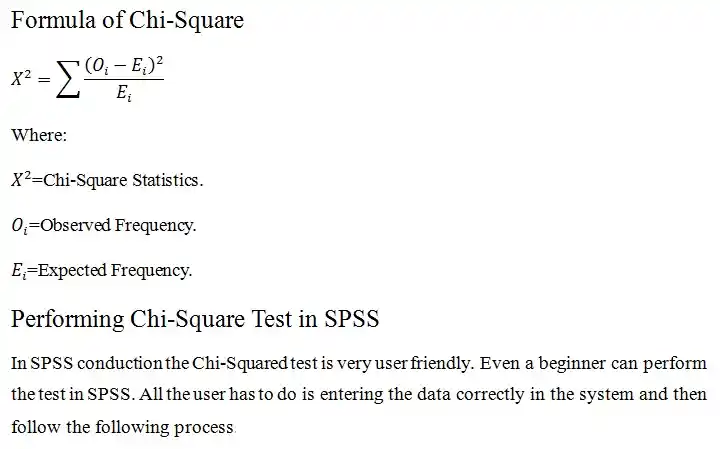
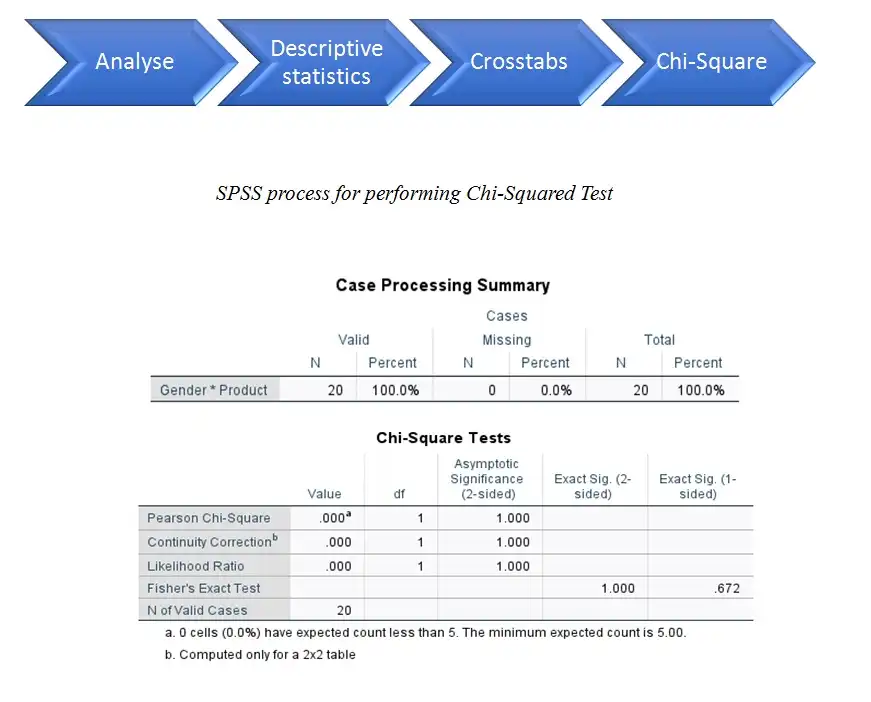
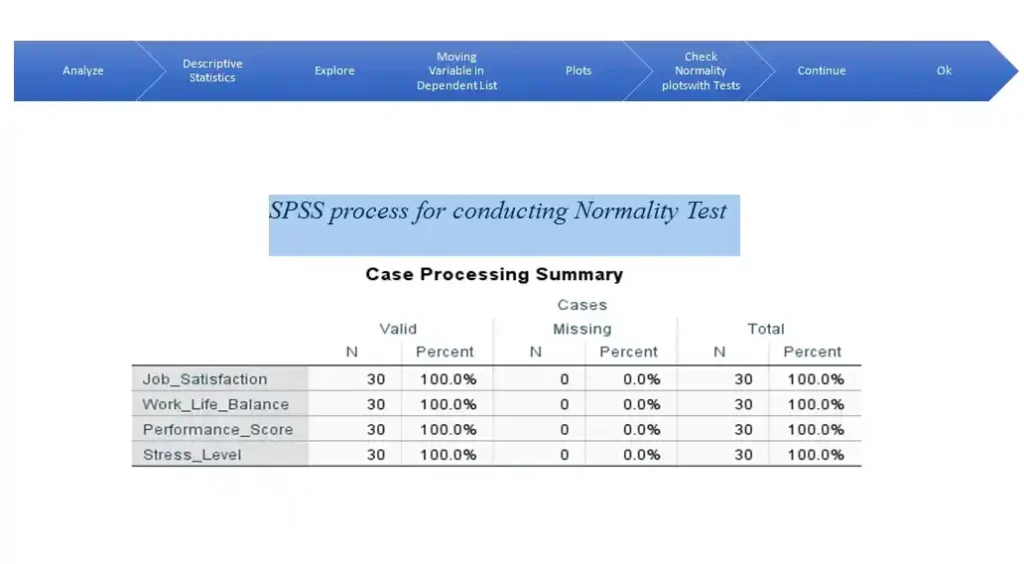
Performing Chi-Square Test in SPSS
In SPSS conduction the Chi-Squared test is very user friendly. Even a beginner can perform the test in SPSS. All the user has to do is entering the data correctly in the system and then follow the following process.
 
															How to do factor analysis in SPSS
Factor Analysis is a statistical process where it is used to understand and identify the underlying pattern or factors within a large set of variables. This process is normally used to reduce the data complexity in a large set of data. To identify the key factors in the surveys. It is also used before doing the regression analysis to cluster or simplify the data.
Types of Factor Analysis
- Exploratory Factor Analysis (EFA).
It is often used when the user is confused about how many factors exist or to which variable these factors belongs.
- Confirmatory Factor Analysis (CFA)
This process is normally used when the user has the idea of theory about the factors to which variables they belong.
Formula of Factor Analysis:
 
															 
															How to check normality in SPSS
The Normality Test is a Statistical process where the user conducts the test to understand whether the data is following a bell-shaped distribution. This test is used to as an important assumption for other statistical test like T-Test, ANOVA, Regression Analysis and Correlation Analysis. The main purpose of this test is to check whether the data distribution is normal . Incase of failure of this test the user has to use the non-parametric test like Mann-Whitney U or the Kruskal Wallis test.


															Conclusion
SPSS provides an important advantage to the scholars in conducting their research works. It is a user-friendly time-tested software which even allows the first time user to perform the tests. The software reduces the calculation errors while reducing the working time ultimately producing perfect research results.
Finally, we at MBA Project guide understand the important role of SPSS in MBA projects and working for last 15yrs helpling students for spss data analysis projects . Our team Uses SPSS as a key analytical tool to transform the raw data to actionable insights . We specialize in Hr, Finance, Marketing and Operations. We ensure is data driven and aligned with critical academic writing.

