
Statistics Help for Your Thesis or Dissertation
Thesis statistics help covers choosing tests that match your research objectives, running the analysis in software such as SPSS, and reporting the results in Chapter 4. At MBA Project Guide, a mentor reviews your questionnaire and data with you, explains each step, and helps you understand the tables before your viva.
We support distance-learning MBA and PGDM students and PhD scholars in India. Share your research objectives and data, and we will suggest suitable tests, explain how to run them, and help you interpret the output.
Who this page is for
This page may help if you have collected survey responses but are unsure how to analyse them. For example:
· You have 150 to 400 questionnaire responses in Excel and a supervisor who wants “the analysis” by next month.
· You have run something in SPSS, but you cannot tell whether the p-value means your hypothesis is supported.
· Your guide has rejected your Chapter 4 and asked you to “use the proper test”.
· You have an SPSS assignment for a research methods course and the menus make no sense. You are a PhD scholar who needs a second pair of eyes on a regression or factor analysis before submission
What our statistical help for dissertation covers
Choosing the test. We look at your objectives, hypotheses, the type of data you have (scale, ordinal, categorical) and your sample size, then pick the test that fits. We explain why, so you can defend the choice.
Preparing the data. Coding responses, reverse-scoring negative items, handling missing values, spotting outliers, and checking whether the data is close enough to normal for the test you want to use.
Running the analysis. Descriptive statistics, reliability, correlation, t-tests, ANOVA, chi-square, regression, and factor analysis, using SPSS, Excel, R, or STATA, based on your university’s requirements and your research needs.
Reading the output. What the significance value says, what the effect size says, and what each table means in plain words.
Writing it up. Table formats, how to word hypothesis results, and how to tie each finding back to your objectives in the Results and Discussion chapters. The writing stays yours. We review it.
Which statistical test fits your research question?
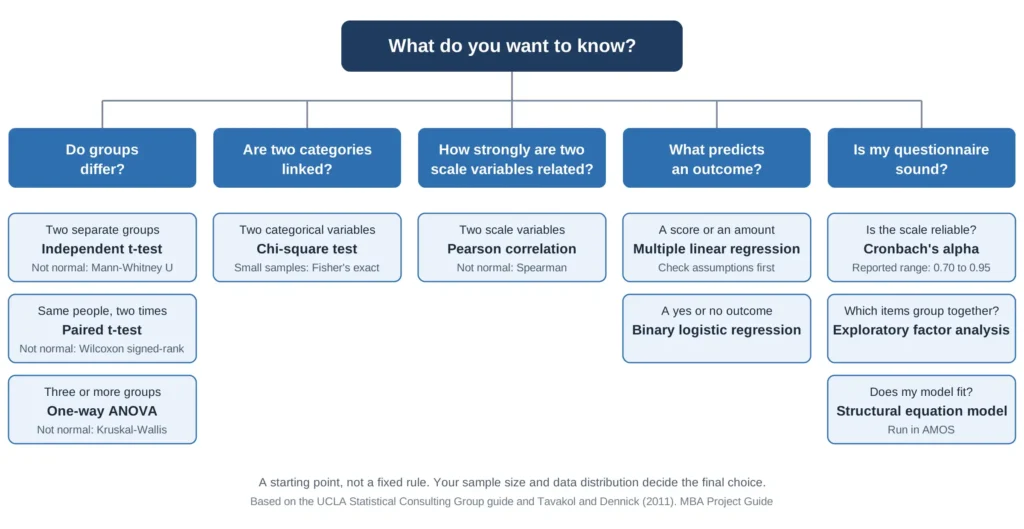
To choose a statistical test, start with your research question. The table below lists common options. Your sample size and data distribution also affect the choice.
| What you want to know | Usual test | If the data is not normal |
| Do two groups differ on a score (for example, male and female managers)? | Independent samples t-test | Mann-Whitney U |
| Did the same people change between two points in time? | Paired t-test | Wilcoxon signed-rank |
| Do three or more groups differ? | One-way ANOVA | Kruskal-Wallis |
| Are two categorical variables linked (for example, gender and brand preference)? | Chi-square test | Fisher’s exact test (small samples) |
| How strongly are two scale variables related? | Pearson correlation | Spearman correlation |
| Which factors predict an outcome such as job satisfaction? | Multiple linear regression | Check assumptions, then consider a transformation |
| Which factors predict a yes or no outcome? | Binary logistic regression | Not applicable |
| Is my questionnaire scale reliable? | Cronbach’s alpha | Not applicable |
| Which questionnaire items group into factors? | Exploratory factor analysis | Not applicable |
| Does my proposed model fit the data? | Structural equation modelling (AMOS) | Not applicable |
The test choices above follow the general guide from the UCLA Statistical Consulting Group, which also treats them as guidelines, not fixed rules.
For reliability, Tavakol and Dennick (2011) report that sources give acceptable Cronbach’s alpha values from 0.70 to 0.95, and suggest a maximum of 0.90 because a higher value can mean some items repeat each other. Most theses use a 5% significance level (p < 0.05), but the American Statistical Association warns against basing conclusions only on whether a p-value crosses a cutoff. We report effect sizes next to p-values for that reason. Your university or guide may set a different standard, so check your guidelines.
Uses of SPSS in data analysis
SPSS is statistical software from IBM. IBM describes it as a tool for statistical analysis, predictive modelling and forecasting, covering regression, factor analysis, bivariate analysis, data preparation and custom tables. Its menu-based interface is why many MBA and social science students use it for their dissertation. In a thesis it is used to:
1. Enter and code survey data, and label variables so tables read clearly.
2. Clean data: find missing values, duplicate entries, and outliers.
3. Produce descriptive statistics such as frequencies, means, and standard deviations.
4. Test reliability with Cronbach’s alpha.
5. Run hypothesis tests: t-tests, ANOVA, chi-square, and nonparametric alternatives.
6. Run correlation and regression, including logistic regression.
7. Run factor analysis to group questionnaire items.
8. Create charts and tables that can be pasted into a thesis.
SPSS menus make it easy to run a test, but the results still depend on choosing the right method and checking its assumptions. We explain both the steps and the reasons for using each test.
SPSS experts and a statistician for hire, with the work kept yours
If you need help with SPSS or statistics, a mentor can review your dataset with you by call or screen share, demonstrate the analysis, and explain each output table. For an SPSS assignment, we guide you through the steps so you can complete the work and repeat the method independently.
You stay the author of your thesis. We do not make up data, and we do not write your thesis for you. We help you analyse your own data correctly and understand the result.
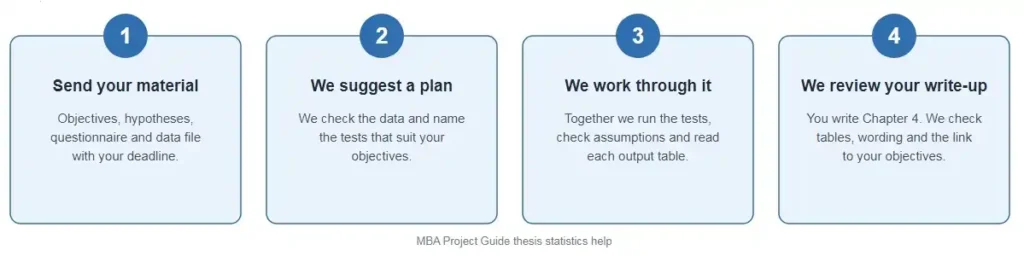
How it works
1. Send your material. Share your research objectives, hypotheses, questionnaire, and data file. Tell us your university, your deadline, and what your guide has asked for.
2. We review and suggest a plan. We check the data and tell you which tests suit your objectives, and what is missing or needs fixing.
3. We work through the analysis with you. We run the tests, check assumptions, and explain the output table by table.
4. We review your write-up. You draft the Results chapter. We check the tables, the wording of the hypothesis results, and the link to your objectives.
Students we work with
MBA Project Guide was founded in the year 2014 as an academic mentorship service. Our students are mostly in distance-learning MBA and PGDM programmes, including IMT CDL, Amity, NMIMS, SP Jain, University of Mysore,UpGrad, and Manipal. PhD scholars and master’s students in management and other social science subjects can also request statistics guidance.
Universities differ in their Chapter 4 format and analysis requirements. Share your university guidelines before work begins so the support can follow the required format.
PhD thesis guidance in India
For PhD scholars, we offer guidance on the statistical parts of the thesis: methodology justification, test selection, regression and factor analysis, structural equation modelling in AMOS, and reviewing your results chapter before it goes to your supervisor. This is mentoring on your own research. It is not a thesis writing service, and you remain responsible for the thesis and its originality.
Frequently asked questions
What is thesis statistics help?
It is support with the statistical part of your thesis or dissertation: choosing tests, preparing data, running the analysis, interpreting the output, and reporting the results in your Results chapter.
Can you help if I have already collected my data but have not started the analysis?
Yes. Most students come to us at this stage. Send your questionnaire and the Excel or SPSS file, and we will tell you what to run and in what order.
Which software do you work with?
SPSS is what most of our MBA students use. We also work with Excel, R, STATA, and AMOS for structural equation modelling.
How do I know which statistical test to use for my thesis?
Start with your objective. Comparing groups, testing a relationship, predicting an outcome, and checking a scale each point to different tests. Then check the type of data and whether it is roughly normal. The table on this page lists the usual choices, and we can confirm yours once we see your data.
Will I understand the analysis well enough for my viva?
You review the analysis with a mentor and discuss the output in clear language. This can help you explain why you selected a test and what the findings mean during your viva.
Do you write the Results chapter for me?
No. You write it. We review your tables and wording and tell you what to fix.
Can you help with an SPSS assignment from my course?
Yes. We go through the steps with you so you can complete it yourself and repeat the method on your next one
My sample is small. Can I still run the analysis?
Often yes, but the choice of test changes. Small samples may call for non-parametric tests. Factor analysis and structural equation modelling (SEM) may require larger samples, depending on the model and data. We can review your sample and discuss which methods it can reasonably support.
Is my data kept private?
We use your data only for your project. If your university or organisation has specific confidentiality needs, tell us before you share the file.
How much does it cost and how long does it take?
Cost and turnaround time depend on your sample size, research objectives, and the analyses required. Share these details to request a quote and estimated timeline.
Get help with your thesis statistics
Send your research objectives and your data, and a mentor will reply with the tests we suggest and what we need from you.